S&P 500 and Nasdaq: S&P 500 inching closer to 5200.0 level
- For the third week in a row, the S&P 500 starts bullish.
- After three weeks, the Nasdaq index again returned above the 18000.0 level.
S&P 500 chart analysis
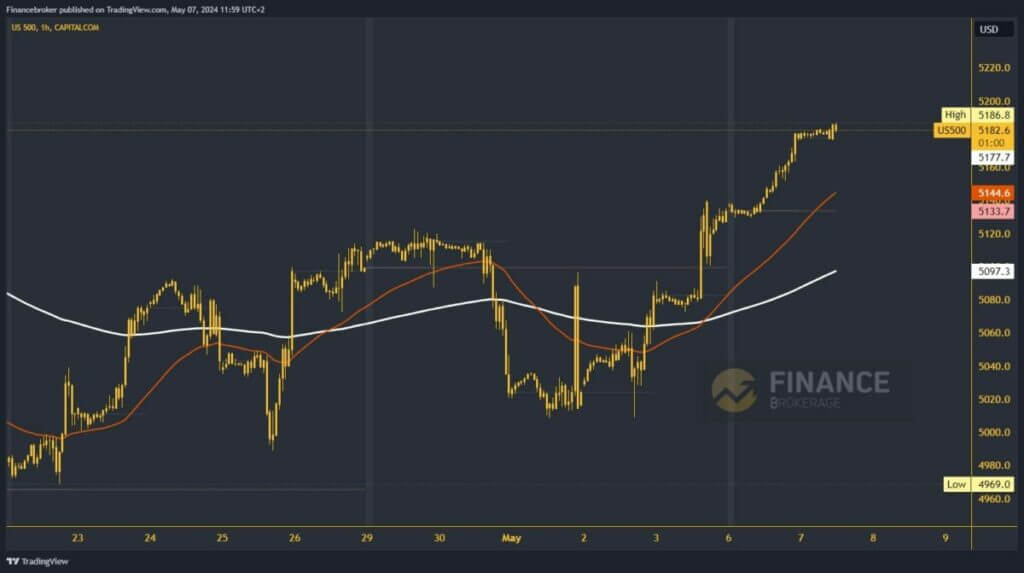
For the third week in a row, the S&P 500 starts bullish. Yesterday, the bullish consolidation continued with the 5130.0 level. During this morning’s Asian session, the index rose to 5180.0, and a new weekly high was formed at 5186.8. We are still holding very high and expect to see further growth to a new high. Potential higher targets are 5200.0 and 5220.0 levels.
We need a negative consolidation and pullback below the 5175.0 level for a bearish option first. With this, we move away from this morning’s high and turn to the bearish side. Falling to 5145.0, we are coming down to test the EMA50 moving average. A little below that, we have the weekly open price at the 5134.0 level. The inability to hold above will push the price below and thus form a new weekly low. Potential lower targets are 5120.0 and 5100.0 levels.

Nasdaq chart analysis
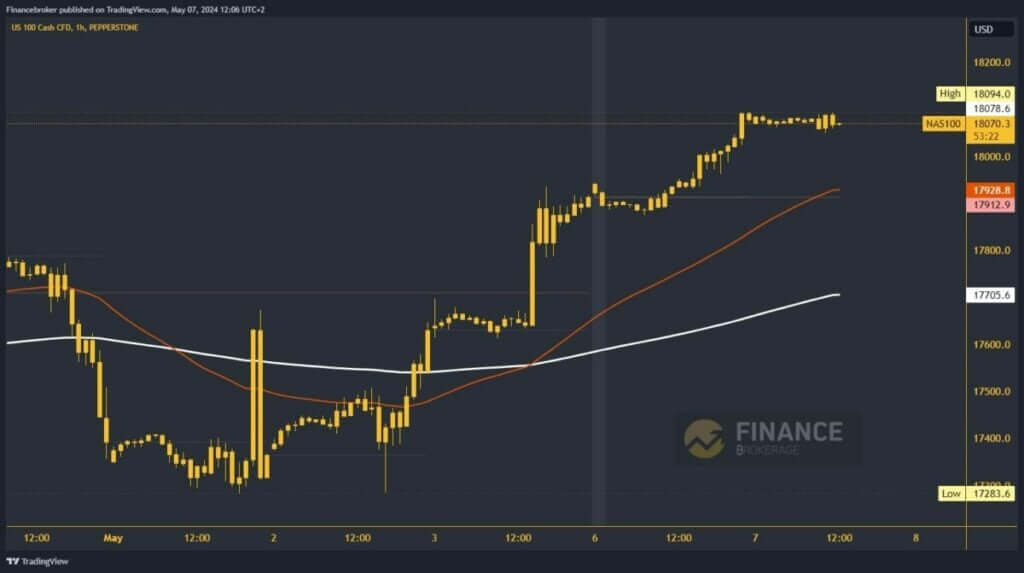
After three weeks, the Nasdaq index again returned above the 18000.0 level. This week’s high was formed last night at the 18094.0 level. During this morning’s Asian session, the movement was quite calm, with support at the 18050.0 level. We expect to remain above this support and further recover to higher levels. Potential higher targets are 18100.0 and 18200.0 levels.
We need negative consolidation and pullback to the 18000.0 level for the bearish option. With that step, we lean to the bearish side and move away from our previous bullish path. After that, we look at the weekly open price at the 17912.0 level, and the additional pressure in that zone is the EMA50 moving average. Potential lower targets are 17900.0 and 17800.0 levels.

The post S&P 500 and Nasdaq: S&P 500 inching closer to 5200.0 level appeared first on FinanceBrokerage.

