S&P 500 index and Nasdaq: Nasdaq on Friday below 17000.0
- The S&P 500 index is in a bullish recovery since the beginning of this week with 4965.5 level
- .The value of the Nasdaq index retreated to 16,970.4 levels on Friday evening.
S&P 500 chart analysis
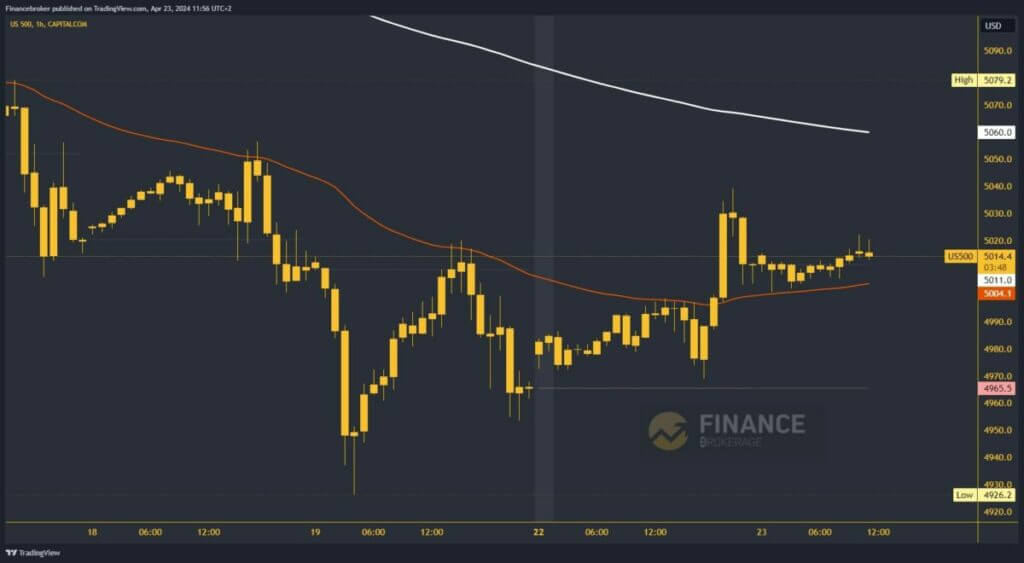
The S&P 500 index is in a bullish recovery since the beginning of this week with 4965.5 level. Last night, the index rose to 5040.0 levels with bullish consolidation. It is now our weekly high, and during this morning’s Asian session, we saw movement in the 5000.0-5010.0 range. We have EMA50 moving average support and expect to hold above and continue the recovery.
Potential higher targets are 5020.0 and 5030.0 levels. Today’s high is at the 5020.0 level and here we have an open that could throw us below the EMA50. With that, we move to the bearish side and test the 5000.0 level. New pressure on that level would only strengthen the bearish picture. The S&P 500 would be forced down to a new daily low. Potential lower targets are 4990.0 and 4980.0 levels.

Nasdaq chart analysis
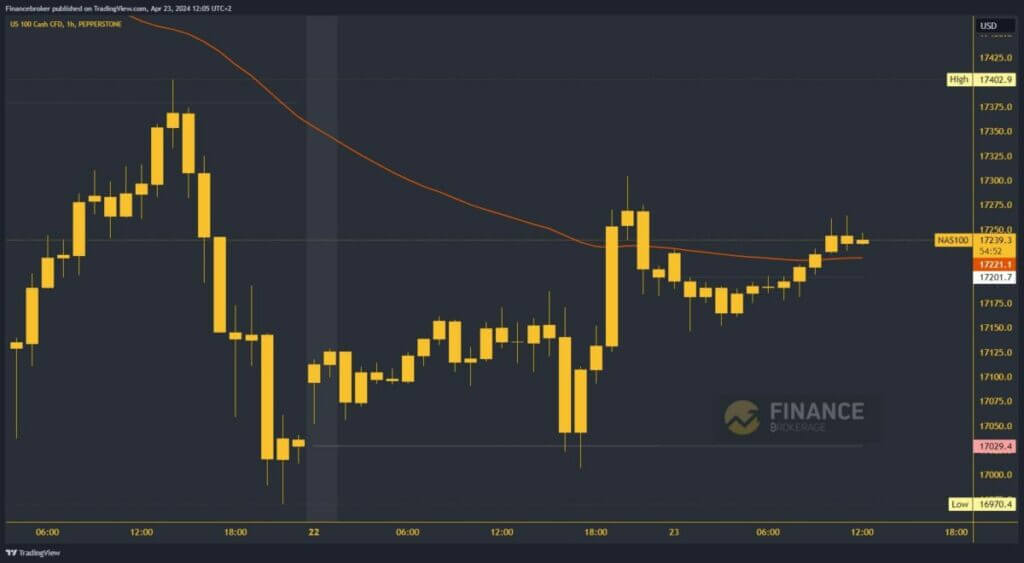
The value of the Nasdaq index retreated to 16,970.4 levels on Friday evening. Thus, we fell below 17,000.0 levels after a long time. At the start of this week, the price makes a bullish gap, hinting at the recovery of the Nasdaq index. Yesterday, we had a retest of support at 17000.0, after which a bullish consolidation to 17320.0 levels was initiated. During this morning’s Asian trading session, the index first retreated to the 17160.0 support level.
With the new support, we went into a retracement and climbed above 17200.0 and the EMA50 moving average. We expect to stay above the live support and start further growth on the bullish side. Potential higher targets are 17300.0 and 17325.0 levels. The value of the Nasdaq is slowly turning to the bullish side, and we expect a recovery by the end of the day.

The post S&P 500 index and Nasdaq: Nasdaq on Friday below 17000.0 appeared first on FinanceBrokerage.

