The dollar index falls below 105.00 ahead of US CPI data
- Today, we are looking at the continued pullback of the dollar index below the 105.00 level.
Dollar index chart analysis
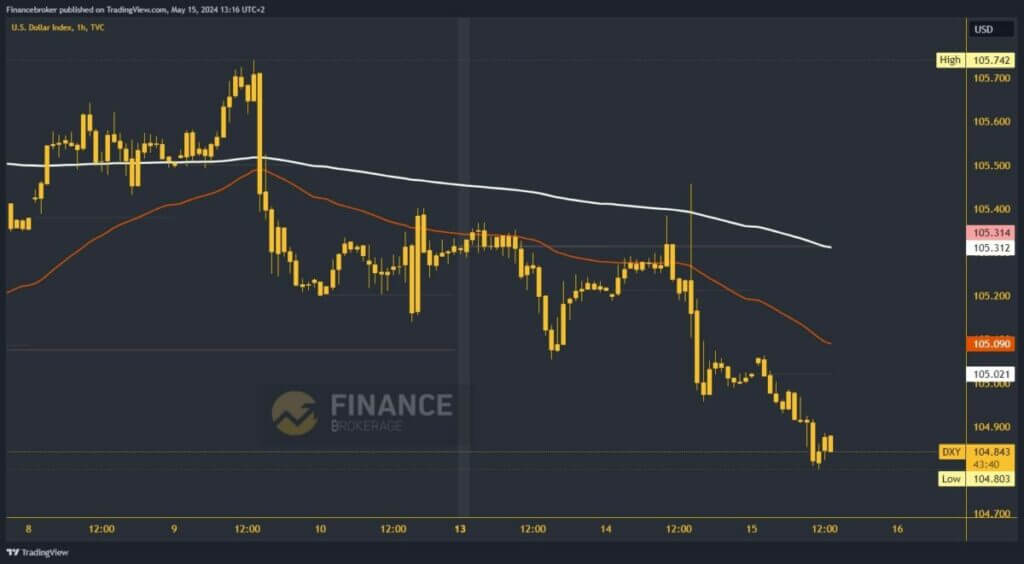
Today, we are looking at the continued pullback of the dollar index below the 105.00 level. Yesterday, we saw the first drop below 105.00, forming a weekly low of 104.96. After that, we had an attempt at stabilization that lasted until this morning’s Asian session. A new bearish consolidation was initiated, and we broke below the previous low.
This leads us to the formation of a new weekly low at the 104.80 level. For now, we are holding above that level and moving up to 104.88. A return above 104.95 would have to indicate that the dollar has bounced back, and we could see a continuation to the bullish side. Potential higher targets are 105.00 and 105.10 levels. The index could face higher resistance in the 105.10 zone, as this is where we encounter the EMA50 moving average.

The dollar is falling below the 105.00 level; should we hope for a new weekly low?
For a bearish option, the dollar index should test the 104.80 level of support. If pressure continues in that zone, we expect to see another bearish impulse and a drop to a lower value on the chart. Potential lower targets are 104.75 and 104.70 levels. The May low is still a little lower at the 104.52 level.
Today we expect very important news at the start of the US session, which is the US CPI. Halfway after the opening of the US session, data on core inflation and total inflation will be published. At the annual level, inflation is expected to decrease by 0.1%. Data in line with forecasts and higher should strengthen the dollar, because it tells us that the Fed will keep the interest rate at the same level. If the inflation data is below expectations, it tells us that the Fed could lower the interest rate at the next meeting. Therefore, the dollar index would continue to fall.
The post The dollar index falls below 105.00 ahead of US CPI data appeared first on FinanceBrokerage.

