S&P 500 and Nasdaq: S&P 500 falls to 5040.0 this morning
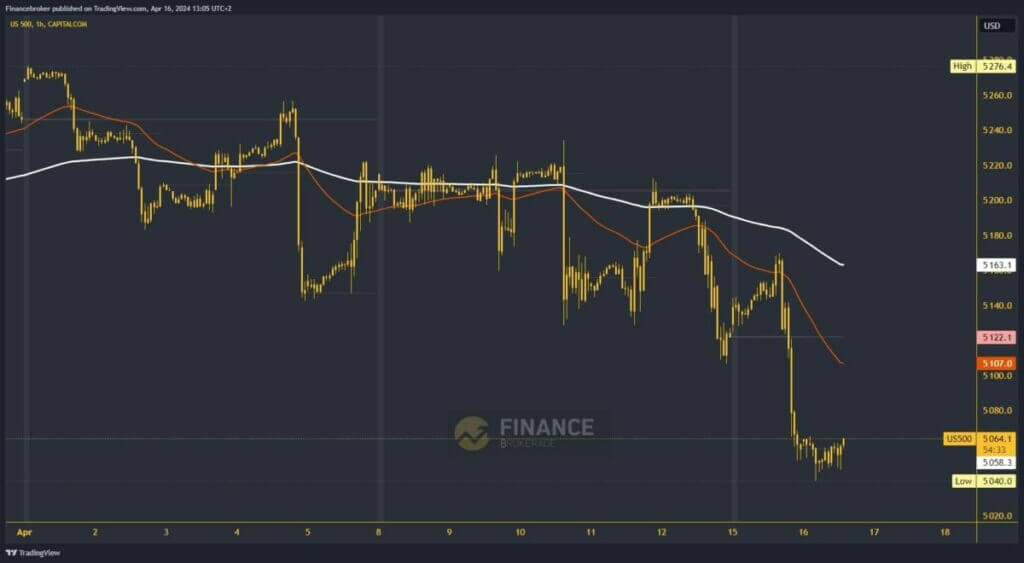
- During the Asian trading session, the S&P 500 index fell to a new low of 5040.0 levels.
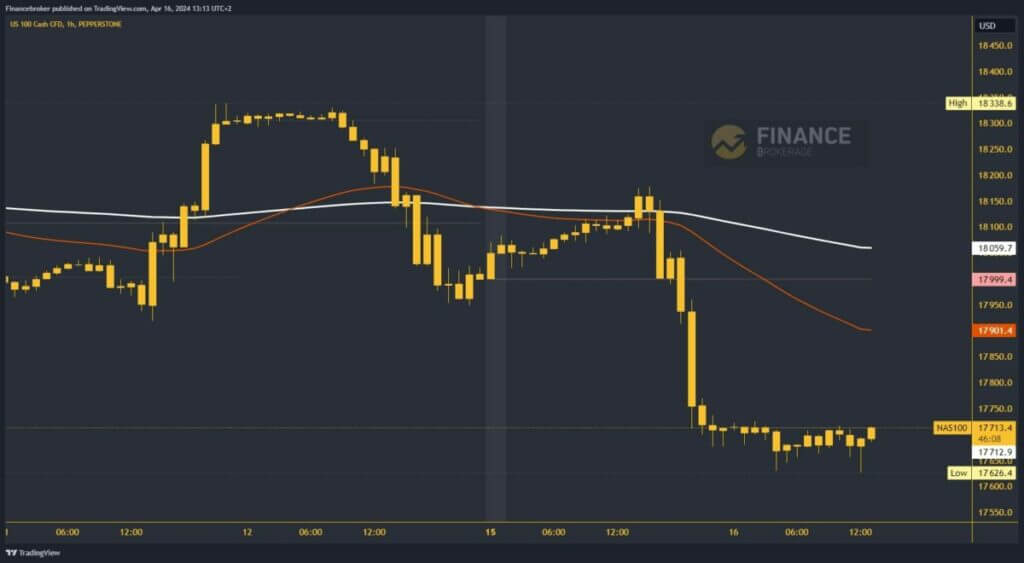
- The Nasdaq made a serious pullback below the 18000.0 level yesterday.
S&P 500 chart analysis
During the Asian trading session, the S&P 500 index fell to a new low of 5040.0 levels. Yesterday, we saw a clear bearish consolidation from the 5170.0 level. The break below the weekly open price only increased the bearish pressure that brought us down to this morning’s low. Now, we are trying to get rid of the bearish pressure and start a bullish consolidation. The current picture tells us that the index could make a new bottom and thus start a recovery.
Potential higher targets are 5080.0 and 5100.0 levels. For a bearish option, need pullback below the 5040.0 level is needed. With that, we go to a new monthly low and get a confirmation of the bearish momentum. This would lead to a continuation of the decline to new high levels. Potential lower targets are 5020.0 and 5000.0 levels.

Nasdaq chart analysis
The Nasdaq made a serious pullback below the 18000.0 level yesterday. During the Asian session, a new weekly low was formed at the 17626.4 level. We remain above that level for now and are waiting for an impulse that would move us above the 17750.0 level. With that step, we would initiate a positive consolidation and recovery of the value of the Nasdaq index. Potential higher targets are 17800.0 and 17850.0 levels.
Additional resistance to our recovery will be in the EMA50 moving average around 17900.0 levels. For a bearish option, we need a continuation of the previous negative consolidation and a drop below the 17625.0 support level. By going below, we go to a new low and thereby confirm the continuation to the bearish side. Potential lower targets are 17600.0 and 17550.0 levels.

The post S&P 500 and Nasdaq: S&P 500 falls to 5040.0 this morning appeared first on FinanceBrokerage.

