S&P 500 Index and Nasdaq: S&P 500 down yesterday to 5215.0
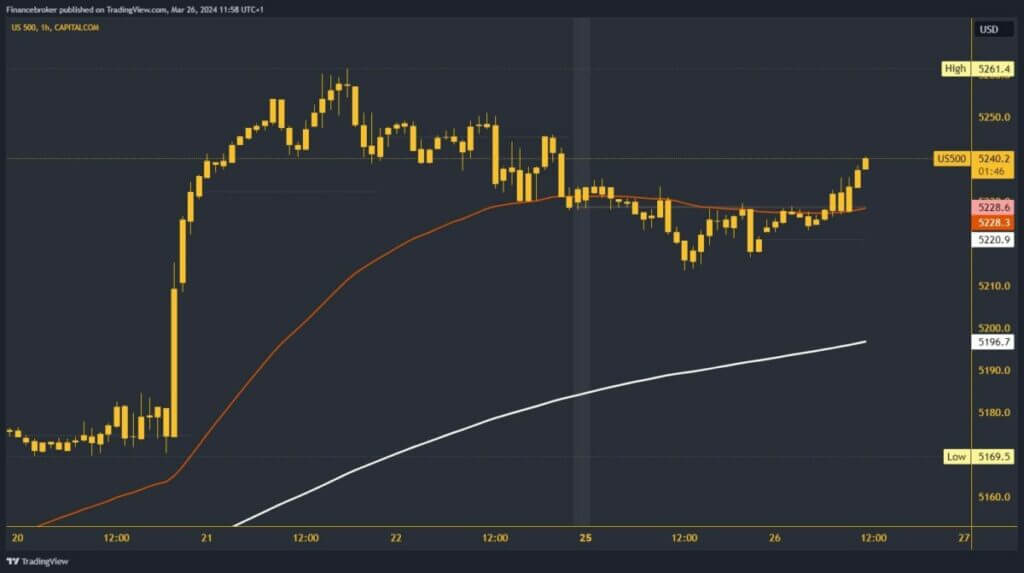
- Yesterday, we saw a continuation of the bearish trend from Friday until support at 5213.6.
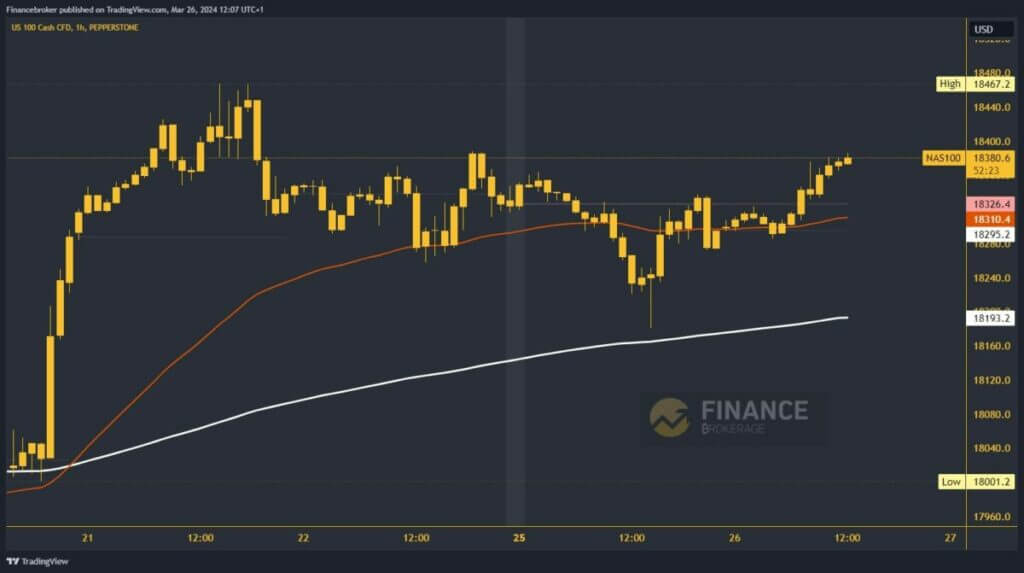
- The Nasdaq retreated to 18181.0 levels yesterday.
S&P 500 index chart analysis
Yesterday, we saw a continuation of the bearish trend from Friday until support at 5213.6. From that level, we start a recovery above the 5230.0 level. We also find support in the EMA50 moving average and reinforce bullish impulses and index recovery. We are currently at 5239.5 and on track to test Friday’s previous high of 5245.0. By the end of the week, we expect to see the S&P 500 at last week’s high and perhaps climb to a new all-time high.
Potential higher targets are 5250.0 and 5260.0 levels. We need a negative consolidation and a pullback of the index value below the 5220.0 level for a bearish option. We are here to test the weekly low. A new test could lead to a drop below and form a new low. Potential lower targets are 5210.0 and 5200.0. The EMA200 moving average is even lower in the zone, around 5200.00.

Nasdaq index chart analysis
The Nasdaq retreated to 18181.0 levels yesterday. We were there briefly because a return above the 18240.0 level soon followed. From there, we started a bullish consolidation that will bring us back above the 18300.0 level by the end of the day. This morning, we continued to grow, and with bullish consolidation, we are going to the 18380.0 level. We expect to continue growing and embark on further recovery.
Potential higher targets are 18400.0 and 18440.0 levels. We need a negative consolidation and pullback below the 18325.0 weekly open price for a bearish option. With that, we move to the bearish side and get confirmation that the Nasdaq is starting to retreat. Potential lower targets are 18280.0 and 18240.0 levels.

The post S&P 500 Index and Nasdaq: S&P 500 down yesterday to 5215.0 appeared first on FinanceBrokerage.

